Functionality available with Analytics
Comparison Dashboard
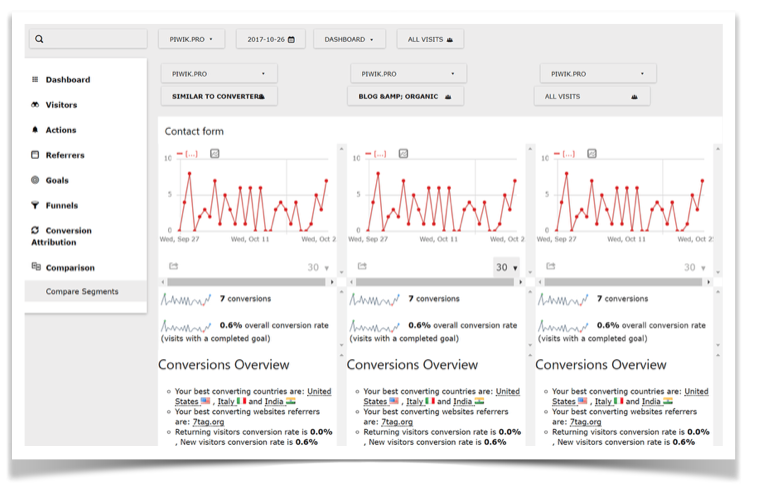
View and compare the most important data from up to three different segments all in one place. Gain deeper insights to attract more traffic and increase conversion. It has the power to cross-reference metrics from multiple websites.

Widgets
Because the Comparison Dashboard uses widgets to display reports, it’s easy to use and understand its functionalities.

Scaling
Scaling ensures that you get an accurate view of the data you’re working to interpret. Unified numbers on the graph scale make comparing segments simple.

Segmentation
Compare reports and dashboards across different segments of visitors, such as comparing e-commerce reporting between mobile and desktop users.

Mutiple websites
Visualize and review reports and dashboards from different websites tracked on the single Analytics tools account.
Comparison Dashboard For Great Power
Compare your most important KPIs across visitor segments and websites. Cross-reference metrics for individual segments to understand how they perform in various combinations. Optimal report layout enhances your understanding of website visitors by identifying differences and similarities in your segments.
Mobile vs. Desktop visitors
Mobile vs Desktop comparison widget allows you to see which kind of device your visitors use the most: iPhone, Android or PC. Make your website more friendly to increase conversion rates.
Funnel dashboard comparison
Compare conversion funnel performance across visitor segments. Learn where you need to optimize your funnel.
Campaign comparison
Facebook? Twitter? Affiliate? Get the details on where your traffic is coming from and evaluate your campaigns with really useful data.